

Reporting & Insights
October 14, 2026
Find data on Culture Priority Places for your 2028-2033 NPO application
# Npo
# Fundraising
# Reporting
Guidance for organisations applying for Arts Council England National Portfolio status in 2026
This guidance is designed to help you report on geographic reach, especially to Culture Priority Places.
You can find more support for your NPO application and other reporting guidance on our blog, or visit the forums to share questions and ideas with other organisations preparing their submissions.
To report on audience geography, you might want to know:
- Which postcode districts do most of our bookers live in?
- What percentage of our unique bookers live in Culture Priority Places?
Watch the video or follow step-by-step instructions below to answer both of these questions.
1. Build a custom report in Spektrix
If this is new to you, there's detailed guidance on how to build a custom report on the Support Centre.
Here we'll focus on the specific criteria you need to report on audience postcode districts.
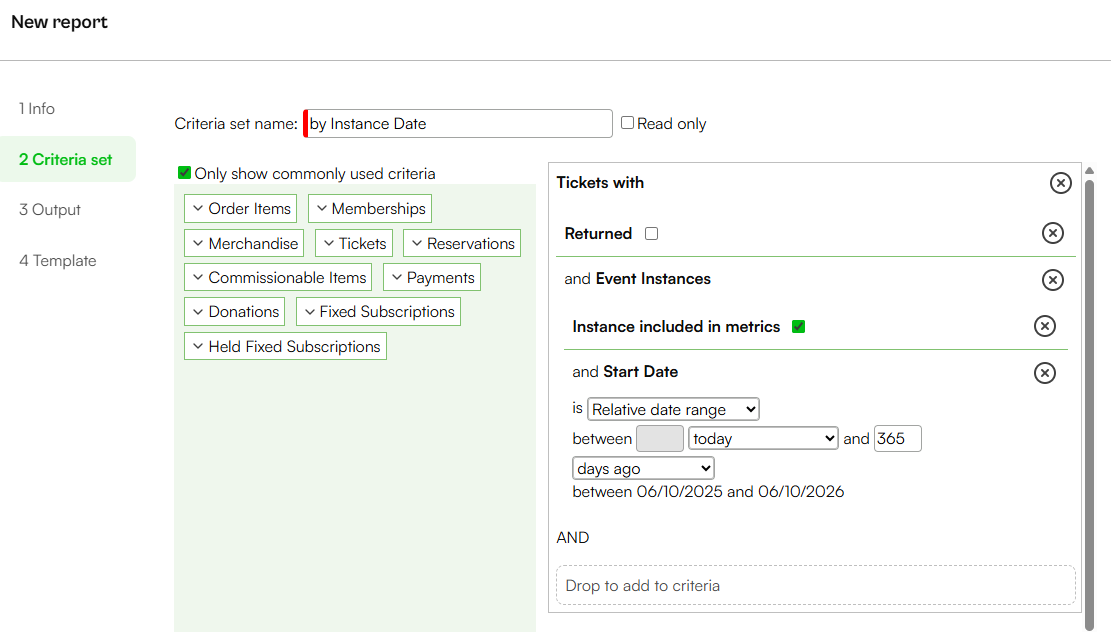
Create a new analysis report with a criteria set looking for the start date of event instances within your specified date range.
You can also add other metrics to filter on specific events or ticket types.
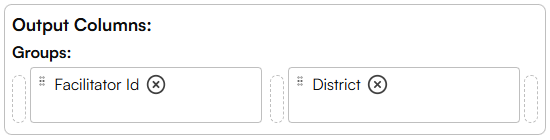
Switch your report to grouped mode and add from the customers wrapper choose Facilitator ID and District for the output columns.
Facilitator ID represents the number of unique bookers.
If you would like to look at the number of tickets instead of bookers, tick the Show Count button in the output when you are in grouped mode.
2. Use an Excel pivot table to explore the data
Run your report as an unformatted Excel sheet and open the file.
Insert a pivot table.
- Click any cell in your spreadsheet
- Go to the Insert tab
- Click PivotTable from Table / Range and select your data
- Place the pivot table on an Existing Worksheet
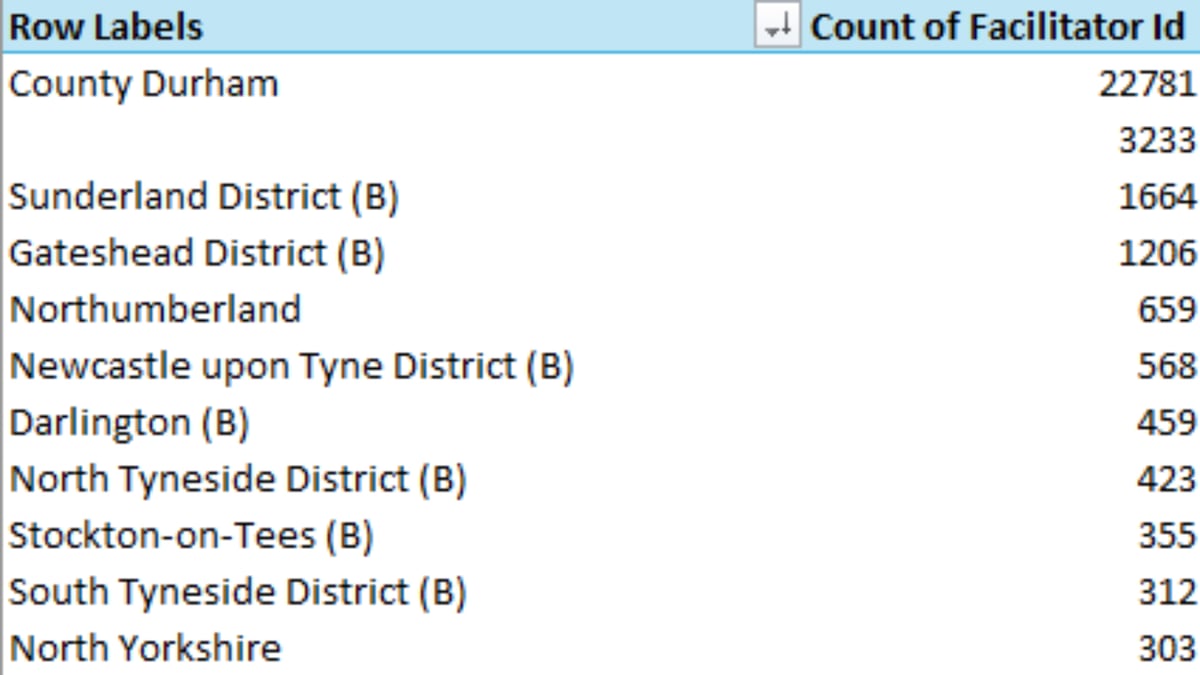
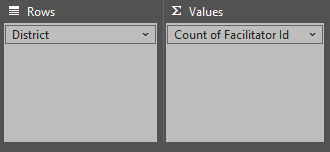
- Drag District into the Rows box and Facilitator Id into the Values box
- Sort the pivot table by Count of Facilitator ID (representing the count of bookers). Right click in any header to enable sorting.
Sort the pivot table by Count of Facilitator ID (representing the count of bookers). Right click in any header to enable sorting.
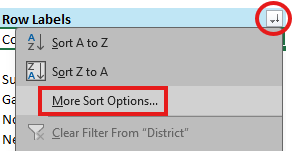
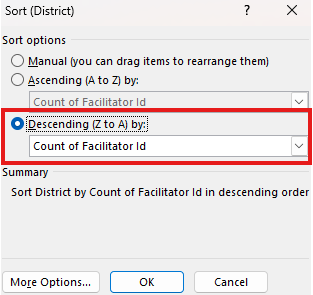
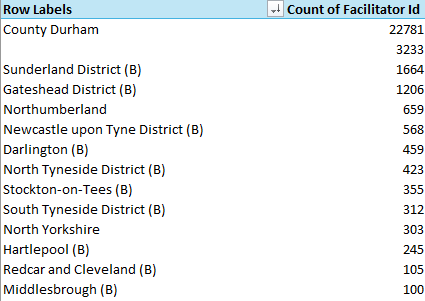
This will produce a complete table of postcode districts.
If you chose Facilitator ID, this shows the number of unique customers living in each postcode district, who made a booking within your chosen timeframe.
If you chose to count the number of tickets, this will show the sum of the number of tickets purchased by people living in each postcode district.
How is District data calculated in Spektrix?
Data on District is automatically populated in Spektrix based on each customer's postcode.
If you looked at district data in early October or beforehand, you may have identified gaps. This was caused by older address records that pre-dated the latest integration of Ordnance Survey postcode data with Spektrix. Where one of these records was used as the reference, District information could appear blank for other customers sharing that postcode.
We have now backfilled all District data to support your NPO application.
This is accurate to 2024, when postcodes were last mapped to Districts. Please reach out if you need any further information.
Comments (0)
Popular

Dive in
Related
Resources
Latest Spektrix and Dotdigital Updates: Payments, Passes, Reporting, and Email ROI
Oct 1st, 2026 • Views 365
Recipes and Toolkits
Recipe: Activate Digital Passes: eTickets for Apple and Google Wallets
Sep 11th, 2026 • Views 79
Resources
Latest Spektrix and Dotdigital Updates: Payments, Passes, Reporting, and Email ROI
Oct 1st, 2026 • Views 365
Recipes and Toolkits
Recipe: Activate Digital Passes: eTickets for Apple and Google Wallets
Sep 11th, 2026 • Views 79